
Same roofing site. New host. Mobile score 63 to 89, overnight.
J&J Roofing is a licensed roofing contractor on the Colorado Front Range. Good site. Real photos of real jobs. On a phone, it took almost eight seconds to show the homeowner anything worth reading.
WATCH THE BEFORE AND AFTER
WHERE THEY STARTED
We ran their homepage through Google PageSpeed Insights on April 13, 2026 at 4:57 in the afternoon.
Desktop was fine. A 94.
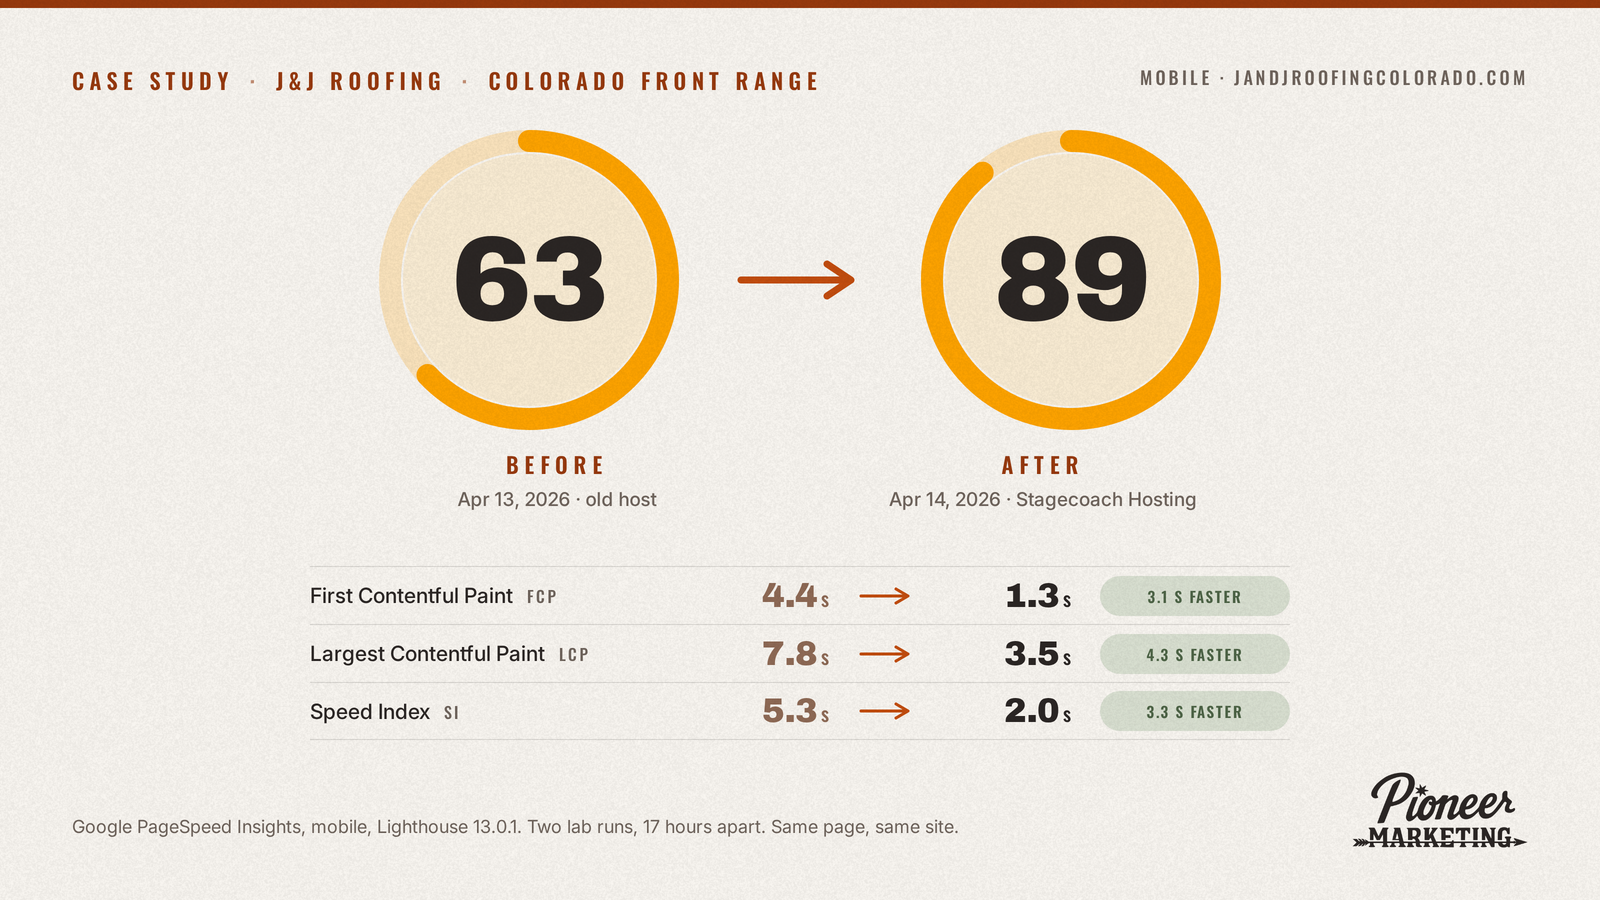
Mobile scored 63. Google’s label for that band is “needs improvement.” First Contentful Paint, the moment anything appears on screen, took 4.4 seconds. Largest Contentful Paint, the moment the main image and headline are up, took 7.8 seconds.
Think about who’s loading that page. A homeowner standing in the driveway after a hailstorm, phone in hand, three roofers open in three tabs. Eight seconds is long enough to tap the next one.
The site itself wasn’t the problem. The server it sat on was.
WHAT WE DID
We moved it. That’s the whole job.
Same WordPress site, same theme, same pages, same images. We migrated it from the old hosting company onto Stagecoach Hosting, our managed WordPress hosting, and tightened a couple of settings on the back end while we were in there. We did not rebuild anything. We hadn’t even compressed the oversized images yet.
Then we ran the exact same test again, 17 hours later.
WHAT HAPPENED
Google PageSpeed Insights, mobile, Lighthouse 13.0.1, same homepage. April 13 at 4:57 PM against April 14 at 10:13 AM.
| Before | After | |
|---|---|---|
| Mobile performance score | 63 | 89 |
| First Contentful Paint | 4.4 s | 1.3 s |
| Largest Contentful Paint | 7.8 s | 3.5 s |
| Speed Index | 5.3 s | 2.0 s |
| Desktop performance score | 94 | 98 |
Cumulative Layout Shift stayed in Google’s “good” range both times. Total Blocking Time stayed at zero on mobile.
The homeowner in the driveway now sees the page in 1.3 seconds instead of 4.4. The hero image and headline are up in 3.5 seconds instead of 7.8. Nobody wrote a line of code to get there.

THE HONEST PART
Two things you should know before you take the number and run.
These are two single lab tests, 17 hours apart. Lighthouse scores drift a few points run to run. We’re comfortable the jump is real because every metric moved the same direction by a lot, but 89 could read 86 or 91 tomorrow. And this is lab data. Real-user field data takes weeks to accumulate, and we don’t have it for this window.
Second, the site isn’t finished. Mobile LCP is 3.5 seconds and Google wants under 2.5. The next step is the boring one: compress the large images, and that’s where the 90-plus lives. A hosting move gets you the floor. It doesn’t get you the ceiling.

WANT TO KNOW WHAT YOUR OWN SITE IS DOING TO YOU ON A PHONE?
The Free AI Growth Audit finds the specific thing costing you jobs right now. We call your business like a customer would and time your response, and we run your site through the same test you just read. You get a short video and a one page fix list within two business days. It’s yours whether or not we ever work together.